The New Economy
Before the bubble, of course, there was the technology. TCP/IP had been standardized in 1983. Email circulated through universities and corporations by the late 1980s. Tim Berners-Lee created the World Wide Web at CERN in 1991. But for most Americans, the internet entered consciousness in 1994 and 1995, when the Netscape Navigator browser transformed the Web from an academic tool into a consumer medium — something you could use to buy books, read news, or waste an afternoon.
August 9, 1995 changed everything. Netscape Communications, incorporated barely sixteen months earlier and without a dollar of profit, priced its IPO shares at $28. They opened at $71, soared to $75, and closed at $58.25. By the end of its first day as a public company, Netscape was valued at $2.9 billion. Marc Andreessen, the company's 24-year-old co-founder, found himself worth $58 million on paper before he had celebrated his first anniversary at the firm.
What the Netscape IPO signaled — to entrepreneurs in Palo Alto garages, to venture capitalists on Sand Hill Road, to day traders in suburban living rooms — was that the internet was not merely a technological innovation but a financial opportunity without precedent. A gold rush began.
Venture Capital and the IPO Machine
Silicon Valley's venture capital industry became the engine of the boom. VC investment in internet companies rose from $1.3 billion in 1995 to $33.4 billion in 2000 — a twenty-five-fold increase in five years. The playbook was straightforward, even mechanical: fund a startup with a plausible internet concept, burn through the cash acquiring customers regardless of cost, and take the company public before anyone asked hard questions about profitability.
Wall Street's IPO market proved spectacularly receptive. In 1999 alone, 457 companies went public on US exchanges, raising $69 billion in total proceeds. First-day returns averaged over 70%. Some debuts bordered on the absurd: theGlobe.com rose 606% on its first day in November 1998, and VA Linux Systems climbed 698% in December 1999, the largest first-day gain in IPO history at that time.
Investment banks gorged on the pipeline. Underwriting fees ran at 7% per offering, plus trading commissions as retail clients clamored for allocations. Conflicts of interest were not hidden — they were structural. Analysts at major banks issued enthusiastic buy recommendations on stocks their own firms were underwriting. Henry Blodget at Merrill Lynch privately described certain stocks he was recommending as "junk" and "a disaster" in internal emails that would later surface in regulatory investigations. Jack Grubman at Salomon Smith Barney and Mary Meeker at Morgan Stanley played similar dual roles, blurring the line between independent research and salesmanship.
The Mania at Its Peak
By late 1999, the market had abandoned any pretense of conventional valuation. Companies with no revenue, no business model, and no plausible path to profitability commanded billion-dollar market caps. Pets.com spent $11.8 million on advertising — including a Super Bowl commercial featuring a sock puppet — while generating only $8.5 million in revenue in 1999. It went public in February 2000 at a valuation of $290 million and was liquidated nine months later, having burned through $147 million.
Traditional metrics — earnings, cash flow, book value — were declared obsolete relics of the "old economy." Analysts invented new yardsticks to justify ever-higher prices: price-to-eyeballs, price-to-clicks, price-to-revenue (since there were no earnings to price against). A widely circulated 1999 report by Blodget valued Amazon.com at $400 per share based on projected revenue growth, though the company had never earned a profit. Amazon's stock did in fact reach $113 before splitting, giving it a market capitalization of $36 billion — more than Barnes & Noble, Borders, Kmart, and Sears combined.
| Company | Peak Valuation | Revenue (Peak Year) | Outcome |
|---|---|---|---|
| Pets.com | $290 million | $8.5 million | Liquidated (Nov 2000) |
| Webvan | $4.8 billion | $178 million | Bankrupt (Jul 2001) |
| eToys | $10 billion | $107 million | Bankrupt (Mar 2001) |
| Kozmo.com | $280 million | ~$3.5 million | Shut down (Apr 2001) |
| Boo.com | $390 million | $1.1 million | Liquidated (May 2000) |
| Amazon | $36 billion | $2.8 billion | Survived; worth $1.5T+ by 2024 |
| eBay | $32 billion | $431 million | Survived; major platform |
Professionals were not the only ones swept up. Online brokerages — E*Trade, Ameritrade, Charles Schwab — made stock trading accessible to ordinary Americans at a cost of a few dollars per trade. Online brokerage accounts tripled from 7.5 million in 1998 to 22 million by 2000. Day trading, once the province of professional floor traders, became a mass phenomenon. Books with titles like Trading for a Living became bestsellers. CNBC covered the market with the breathless cadence of sports broadcasting, complete with tickers, scoreboards, and color commentary on the day's winners and losers.
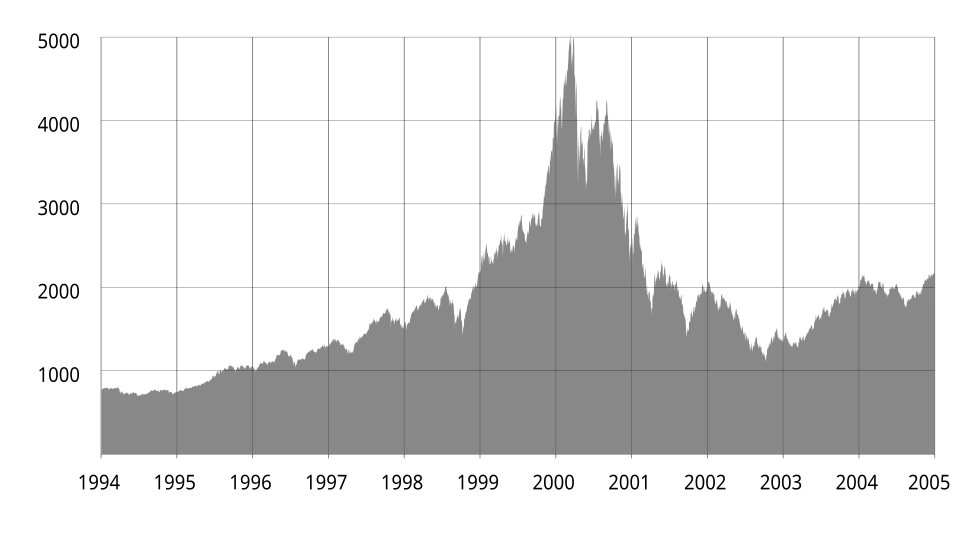
Source: NASDAQ historical data
The Crash
March 10, 2000: the NASDAQ Composite peaked at 5,048.62. No single trigger toppled it. The Federal Reserve had been raising interest rates since June 1999, pushing the fed funds rate from 4.75% to 6.0% by March. Barron's published a widely read cover story titled "Burning Up" that month, examining cash burn rates at internet companies and concluding many would run out of money within a year. And time itself was working against the hype — companies that had gone public in the frenzy of 1998-1999 were now old enough to have measurable track records, and for most, the results were dismal.
At first the decline was orderly, almost gentle. Then it accelerated. By April 14, the NASDAQ had fallen to 3,321 — a 34% drop in five weeks. A partial rally followed, then a renewed slide. The September 11 attacks administered another shock in 2001, though the bear market was already entrenched. On October 9, 2002, the NASDAQ hit its ultimate low of 1,114 — down 78% from its peak, with approximately $5 trillion in market value erased. It would not regain its March 2000 high until April 2015, fifteen years later.
An estimated 8,000 dot-com companies failed or were acquired at fire-sale prices between 2000 and 2003. Silicon Valley alone shed roughly 100,000 technology jobs. Individual investors who had concentrated their portfolios in tech stocks — often on margin — watched their savings evaporate. A concentrated tech portfolio could easily suffer a maximum drawdown exceeding 90%.
The Regulatory Aftermath
As the wreckage settled, investigators found fraud woven through the boom. New York Attorney General Eliot Spitzer led probes into conflicts of interest at major investment banks, unearthing internal emails in which analysts privately mocked stocks they were publicly recommending. "There's nothing interesting about any of these companies," Blodget wrote in one message about internet stocks he was urging clients to buy. In April 2003, ten major banks agreed to the Global Research Settlement, paying $1.4 billion in fines and submitting to structural reforms separating research from investment banking — echoing the spirit of the Glass-Steagall Act that had originally walled off commercial from investment banking.
Congress responded with the Sarbanes-Oxley Act of 2002, passed in the wake of the Enron and WorldCom accounting scandals that the same culture of hype and loose oversight had enabled. New requirements for corporate governance, financial reporting, and auditor independence followed. Regulation Fair Disclosure (Reg FD), adopted in 2000, required companies to disclose material information to all investors simultaneously, ending the cozy practice of briefing favored analysts before anyone else.
Survivors and the Real Legacy
Roughly 8,000 companies died. A handful became some of the most valuable enterprises in human history. That paradox sits at the center of the dot-com story. Amazon survived its stock falling 93% from peak to trough and went on to reinvent retail. eBay endured. Google, founded in 1998 during the mania's peak but not taken public until 2004, built the dominant advertising platform of the internet age.
The parallel to the Railway Mania of the 1840s is instructive. Speculative capital in Victorian Britain built a national railway network that enriched society long after it bankrupted most of its original investors. Similarly, the dot-com era financed the laying of fiber-optic cable, the construction of data centers, the development of e-commerce infrastructure, and the training of a generation of software engineers. Investors lost trillions. The infrastructure they financed created wealth for decades afterward. In that tension — between behavioral biases in investing and genuine technological transformation — lies the dot-com bubble's most durable insight: the crowd can be right about the future and wrong about the price at the same time.
Related
Historical records Learn more about our methodology.